|
Coriolis Pharma
mass flow meter Mass Flow Meter, supplied by Coriolis Pharma, used in various techniques. Bioz Stars score: 90/100, based on 1 PubMed citations. ZERO BIAS - scores, article reviews, protocol conditions and more https://www.bioz.com/result/mass flow meter/product/Coriolis Pharma Average 90 stars, based on 1 article reviews
mass flow meter - by Bioz Stars,
2026-04
90/100 stars
|
Buy from Supplier |
|
Coriolis Pharma
flow meter Flow Meter, supplied by Coriolis Pharma, used in various techniques. Bioz Stars score: 90/100, based on 1 PubMed citations. ZERO BIAS - scores, article reviews, protocol conditions and more https://www.bioz.com/result/flow meter/product/Coriolis Pharma Average 90 stars, based on 1 article reviews
flow meter - by Bioz Stars,
2026-04
90/100 stars
|
Buy from Supplier |
|
Coriolis Pharma
coriolis flow meter Coriolis Flow Meter, supplied by Coriolis Pharma, used in various techniques. Bioz Stars score: 90/100, based on 1 PubMed citations. ZERO BIAS - scores, article reviews, protocol conditions and more https://www.bioz.com/result/coriolis flow meter/product/Coriolis Pharma Average 90 stars, based on 1 article reviews
coriolis flow meter - by Bioz Stars,
2026-04
90/100 stars
|
Buy from Supplier |
|
Verlag GmbH
continuous-flow Continuous Flow, supplied by Verlag GmbH, used in various techniques. Bioz Stars score: 90/100, based on 1 PubMed citations. ZERO BIAS - scores, article reviews, protocol conditions and more https://www.bioz.com/result/continuous-flow/product/Verlag GmbH Average 90 stars, based on 1 article reviews
continuous-flow - by Bioz Stars,
2026-04
90/100 stars
|
Buy from Supplier |
|
MathWorks Inc
the improved flow cytometry data reading and visualization tool The Improved Flow Cytometry Data Reading And Visualization Tool, supplied by MathWorks Inc, used in various techniques. Bioz Stars score: 90/100, based on 1 PubMed citations. ZERO BIAS - scores, article reviews, protocol conditions and more https://www.bioz.com/result/the improved flow cytometry data reading and visualization tool/product/MathWorks Inc Average 90 stars, based on 1 article reviews
the improved flow cytometry data reading and visualization tool - by Bioz Stars,
2026-04
90/100 stars
|
Buy from Supplier |
|
Illumina Inc
illumina assembly Illumina Assembly, supplied by Illumina Inc, used in various techniques. Bioz Stars score: 90/100, based on 1 PubMed citations. ZERO BIAS - scores, article reviews, protocol conditions and more https://www.bioz.com/result/illumina assembly/product/Illumina Inc Average 90 stars, based on 1 article reviews
illumina assembly - by Bioz Stars,
2026-04
90/100 stars
|
Buy from Supplier |
|
KAUST Core Labs
kaust-7 Kaust 7, supplied by KAUST Core Labs, used in various techniques. Bioz Stars score: 90/100, based on 1 PubMed citations. ZERO BIAS - scores, article reviews, protocol conditions and more https://www.bioz.com/result/kaust-7/product/KAUST Core Labs Average 90 stars, based on 1 article reviews
kaust-7 - by Bioz Stars,
2026-04
90/100 stars
|
Buy from Supplier |
|
Oxford Nanopore
latest r 9.4 and r10 flow cell Latest R 9.4 And R10 Flow Cell, supplied by Oxford Nanopore, used in various techniques. Bioz Stars score: 90/100, based on 1 PubMed citations. ZERO BIAS - scores, article reviews, protocol conditions and more https://www.bioz.com/result/latest r 9.4 and r10 flow cell/product/Oxford Nanopore Average 90 stars, based on 1 article reviews
latest r 9.4 and r10 flow cell - by Bioz Stars,
2026-04
90/100 stars
|
Buy from Supplier |
|
Addgene inc
whole genome knockout crispr library v1  Whole Genome Knockout Crispr Library V1, supplied by Addgene inc, used in various techniques. Bioz Stars score: 95/100, based on 1 PubMed citations. ZERO BIAS - scores, article reviews, protocol conditions and more https://www.bioz.com/result/whole genome knockout crispr library v1/product/Addgene inc Average 95 stars, based on 1 article reviews
whole genome knockout crispr library v1 - by Bioz Stars,
2026-04
95/100 stars
|
Buy from Supplier |
|
ACROBiosystems
sars-cov-2 s protein 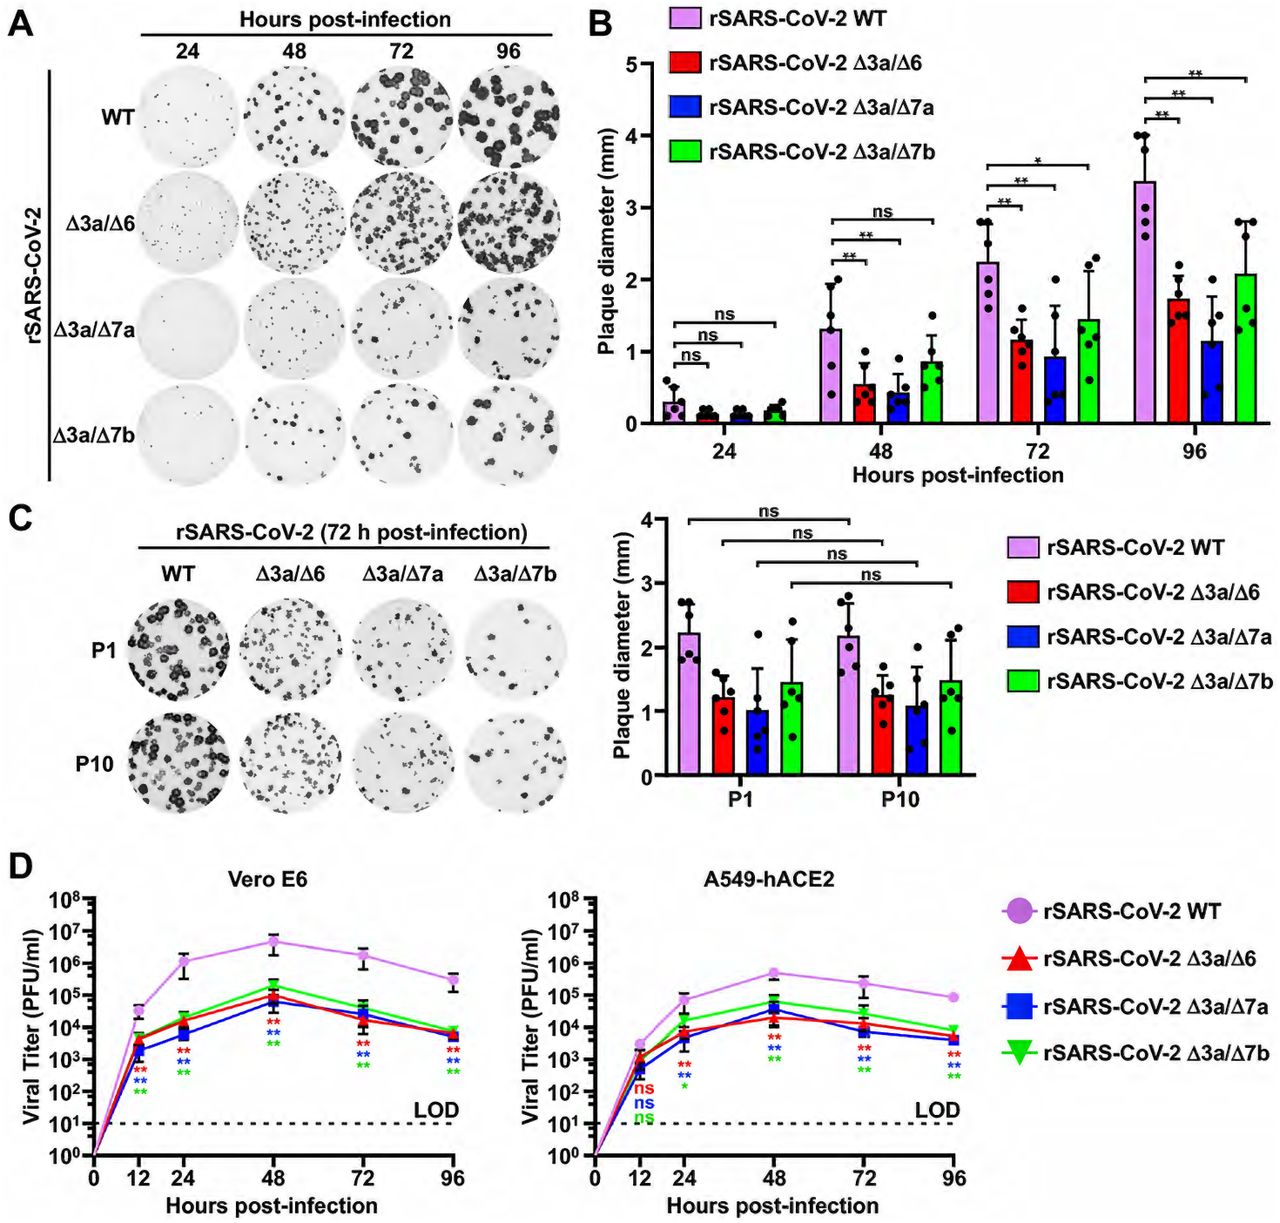 Sars Cov 2 S Protein, supplied by ACROBiosystems, used in various techniques. Bioz Stars score: 90/100, based on 1 PubMed citations. ZERO BIAS - scores, article reviews, protocol conditions and more https://www.bioz.com/result/sars-cov-2 s protein/product/ACROBiosystems Average 90 stars, based on 1 article reviews
sars-cov-2 s protein - by Bioz Stars,
2026-04
90/100 stars
|
Buy from Supplier |
|
Funken Powtechs INC
continuous injection mixer, flow jet mixer, mw-f-300 type (improved version in which a pin on the rotary table has been removed) Continuous Injection Mixer, Flow Jet Mixer, Mw F 300 Type (Improved Version In Which A Pin On The Rotary Table Has Been Removed), supplied by Funken Powtechs INC, used in various techniques. Bioz Stars score: 90/100, based on 1 PubMed citations. ZERO BIAS - scores, article reviews, protocol conditions and more https://www.bioz.com/result/continuous injection mixer, flow jet mixer, mw-f-300 type (improved version in which a pin on the rotary table has been removed)/product/Funken Powtechs INC Average 90 stars, based on 1 article reviews
continuous injection mixer, flow jet mixer, mw-f-300 type (improved version in which a pin on the rotary table has been removed) - by Bioz Stars,
2026-04
90/100 stars
|
Buy from Supplier |
|
FUJIFILM
lateral flow test fujifilm silvamp tb lam Lateral Flow Test Fujifilm Silvamp Tb Lam, supplied by FUJIFILM, used in various techniques. Bioz Stars score: 90/100, based on 1 PubMed citations. ZERO BIAS - scores, article reviews, protocol conditions and more https://www.bioz.com/result/lateral flow test fujifilm silvamp tb lam/product/FUJIFILM Average 90 stars, based on 1 article reviews
lateral flow test fujifilm silvamp tb lam - by Bioz Stars,
2026-04
90/100 stars
|
Buy from Supplier |
Image Search Results
Journal: bioRxiv
Article Title: SOD1 is a synthetic lethal target in PPM1D -mutant leukemia cells
doi: 10.1101/2023.08.31.555634
Figure Lengend Snippet: (A) Immunoblot validation of PPM1D -mutant Cas9-expressing OCI-AML2 cells generated and used for CRISPR screening. Blots were probed with anti-PPM1D (1:1000) and GAPDH (1:1000). Clones 2102 and 2113 were selected for the dropout screen. (B) Venn diagram of genes that were depleted from the two PPM1D -mutant clones (#2102, 2113) used in the dropout screen, but not depleted in the WT control lines. 37 genes were found to be depleted in both mutant clones. For a full list of genes, see Figure 1-source data 1. (C) Volcano plot of synthetic lethal hits ranked by fitness score with the Fanconi Anemia pathway genes highlighted in blue. (D) Cas9-OCI-AML2 and Cas9-OCI-AML3 WT or PPM1D -mutant cells were transduced with the empty vector control backbone tagged with a blue fluorescent protein (BFP) reporter. Cells were assayed by flow cytometry between 3- and 24-days post-transduction and normalized to the BFP percentage at day 3. Data shown are mean + SD (n=2 per condition).
Article Snippet: For large-scale production of lentivirus, 15 cm plates of 80-90% confluent 293T cells were transfected using Lipofectamine 2000 (Invitrogen) with 7.5 ug of the Human Improved
Techniques: Western Blot, Biomarker Discovery, Mutagenesis, Expressing, Generated, CRISPR, Clone Assay, Control, Transduction, Plasmid Preparation, Flow Cytometry

Journal: bioRxiv
Article Title: SOD1 is a synthetic lethal target in PPM1D -mutant leukemia cells
doi: 10.1101/2023.08.31.555634
Figure Lengend Snippet: (A) Schematic of whole-genome CRISPR dropout screen. WT Cas9-expressing OCI-AML2 and two isogenic PPM1D -mutant lines with three technical replicates were transduced with the Human Improved Whole Genome Knockout CRISPR library V1 containing 90,709 guide RNAs (gRNAs) targeting 18,010 human genes at low multiplicity of infection (MOI∼0.3). Three days post-transduction, cells underwent puromycin selection for three days. Cells were harvested at day 10 as the initial timepoint and then harvested every three days. sgRNA sequencing was performed on cells collected on day 28. (B) Top biological processes based on gene ontology analysis of the top 37 genes essential for PPM1D -mutant cell survival. Enrichment and depletion of guides and genes were analyzed using MAGeCK-VISPR by comparing read counts from each PPM1D -mutant cell line replicate with counts from the initial starting population at day ten. (C) Volcano plot of synthetic lethal hits ranked by fitness score with a negative score indicating genes for which their knockout leads decreased growth or survival. SOD1 (highlighted) was the top hit from the screen. (D) Left: Schematic of competitive proliferation assays used for validation of CRISPR targets. Right: WT and PPM1D- mutant Cas9-OCI-AML2 and Cas9-OCI-AML3 cells were transduced with lentivirus containing a single SOD1 -gRNA with a blue fluorescent protein (BFP) reporter. Cells were assayed by flow cytometry every 3-4 days post-transduction and normalized to the BFP percentage at day 3. Two unique gRNAs against SOD1 were used per cell line and each condition was performed in technical duplicates; multiple unpaired t-tests, **p<0.01, ***p<0.001.
Article Snippet: For large-scale production of lentivirus, 15 cm plates of 80-90% confluent 293T cells were transfected using Lipofectamine 2000 (Invitrogen) with 7.5 ug of the Human Improved
Techniques: CRISPR, Expressing, Mutagenesis, Transduction, Knock-Out, Infection, Selection, Sequencing, Biomarker Discovery, Flow Cytometry
Journal: bioRxiv
Article Title: Immunization with recombinant accessory protein-deficient SARS-CoV-2 protects against lethal challenge and viral transmission
doi: 10.1101/2022.03.13.484172
Figure Lengend Snippet: (A) Plaque phenotype. Plaque phenotypes of the WT and double ORF-deficient rSARS-CoV-2 in Vero E6 cells. Plaques were visualized by immunostaining with a monoclonal antibody (1C7C7) against the viral N protein. (B) Viral plaque size analysis. Six plaques were randomly selected and measured using a standard ruler (millimeters, mm). Data is presented as means ± standard deviation (SD). *, P <0.05; **, P <0.01; ns, not significant. (C) In vitro stability. The P1 and P10 of the WT and double ORF-deficient rSARS-CoV-2 were analyzed by plaque assay in Vero E6 cells. The plaques were visualized by immunostaining with the 1C7C7 monoclonal antibody against the viral N protein, and six plaques were random selected and measured with a standard ruler (mm). Data is presented as means ± SD. ns, not significant. (D) Growth kinetics. Viral growth kinetics of the WT and double ORF-deficient rSARS-CoV-2 in Vero E6 (left) and A549-hACE2 (right) cells. Dotted lines indicate the limit of detection (LOD). Data is presented as means ± SD. Statistical analysis was performed between the double ORF-deficient rSARS-CoV-2 and rSARS-CoV-2 WT. *, P <0.05; **, P <0.01; ns, not significant.
Article Snippet:
Techniques: Immunostaining, Standard Deviation, In Vitro, Plaque Assay
Journal: bioRxiv
Article Title: Immunization with recombinant accessory protein-deficient SARS-CoV-2 protects against lethal challenge and viral transmission
doi: 10.1101/2022.03.13.484172
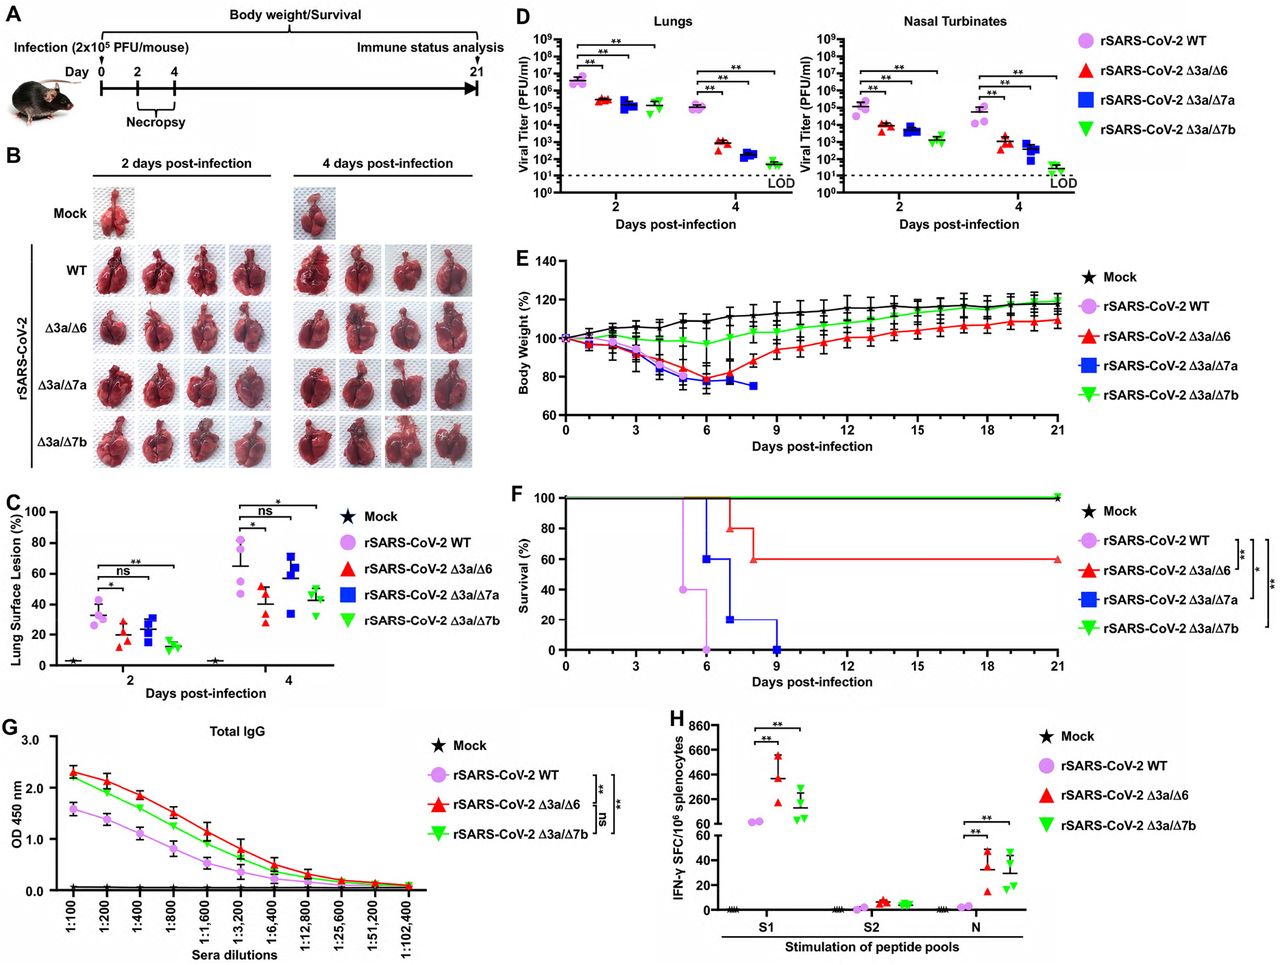
Figure Lengend Snippet: (A) Schematic representation of the experimental timeline used to infect K18 hACE2 transgenic mice with the WT and double ORF-deficient rSARS-CoV-2. (B) Pathological lesions in the lung surface of K18 hACE2 transgenic mice mock-infected or infected (2×10 5 PFU/mouse, n=4) with the indicated rSARS-CoV-2 at 2 and 4 dpi. (C) Pathological lesion scoring on the lung images in panel B using ImageJ. (D) Viral titers in the clarified homogenate of lungs (left) and nasal turbinates (right) of K18 hACE2 transgenic mice infected in panel B at 2 and 4 dpi. (E) Body weight changes in K18 hACE2 transgenic mice mock-infected or infected (2×10 5 PFU/mouse, n=5) with the indicated WT or double ORF-deficient rSARS-CoV-2. (F) Survival curves of K18 hACE2 transgenic mice infected in E were calculated and plotted using daily observations for 21 days. *, P <0.05; **, P <0.01. (G) Total levels of IgG against viral full-length S protein in the sera from the mice that survived in panel F were tested by ELISA at 21 dpi. The sera collected from the two surviving K18 hACE2 mice infected with rSARS-CoV-2 WT (10 3 PFU/mouse, n=5) for 21 days were included as a positive control. **, P <0.01; ns, not significant. (H) Splenocytes were isolated from the mice that survived in panel F at 21 dpi, and IFN-γ-specific spot-forming cells (SFC) were counted after stimulation with peptide pools of S1, S2, and N using flow cytometry. The splenocytes isolated from the two surviving K18 hACE2 mice infected with rSARS-CoV-2 WT (10 3 PFU/mouse, n=5) for 21 days were included as a positive control. **, P <0.01.
Article Snippet:
Techniques: Transgenic Assay, Infection, Enzyme-linked Immunosorbent Assay, Positive Control, Isolation, Flow Cytometry

Journal: bioRxiv
Article Title: Immunization with recombinant accessory protein-deficient SARS-CoV-2 protects against lethal challenge and viral transmission
doi: 10.1101/2022.03.13.484172
Figure Lengend Snippet: (A) Schematic representation of the experimental timeline used for the protection studies with rSARS-CoV-2 Δ3a/Δ7b in K18 hACE2 transgenic mice challenge with rSARS-CoV-2 mCherryNluc. (B) In vivo imaging of K18 hACE2 transgenic mice mock-vaccinated or vaccinated with rSARS-CoV-2 Δ3a/Δ7b at 2 and 4 days post-challenge with rSARS-CoV-2 mCherryNluc (n=4). Mock-vaccinated and mock-challenge K18 hACE2 transgenic mice were used as controls. (C) Quantitative analysis of Nluc expression in K18 hACE2 transgenic mice from B. **, P <0.01; ns, not significant. (D) Body weight changes of mock-vaccinated or rSARS-CoV-2 Δ3a/Δ7b-vaccinated K18 hACE2 transgenic mice were monitored for 15 days after challenge with rSARS-CoV-2 mCherryNluc. Mock-vaccinated and mock-challenge K18 hACE2 transgenic mice were used as controls. (E) Survival curves of mock-vaccinated or rSARS-CoV-2 Δ3a/Δ7b-vaccinated K18 hACE2 transgenic mice after challenge with rSARS-CoV-2 mCherryNluc. Mock-vaccinated and mock-challenge K18 hACE2 transgenic mice were used as controls. **, P <0.01; ns, not significant.
Article Snippet:
Techniques: Transgenic Assay, In Vivo Imaging, Expressing

Journal: bioRxiv
Article Title: Immunization with recombinant accessory protein-deficient SARS-CoV-2 protects against lethal challenge and viral transmission
doi: 10.1101/2022.03.13.484172
Figure Lengend Snippet: (A) Schematic representation of the experimental timeline used for the protection studies with the double ORF-deficient rSARS-CoV-2 in hamsters. (B) Body weight changes of mock-infected and WT or double ORF-deficient rSARS-CoV-2 infected hamsters were monitored for 21 days. **, P <0.01; ns, not significant. (C) In vivo imaging of the rSARS-CoV-2 mCherryNluc replication in hamsters at 2 and 4 days post-challenge. (D) Quantitative analysis of Nluc expression in hamsters from panel C at 2 (left) and 4 (right) days post-challenge with rSARS-CoV-2 mCherryNluc.
Article Snippet:
Techniques: Infection, In Vivo Imaging, Expressing

Journal: bioRxiv
Article Title: Immunization with recombinant accessory protein-deficient SARS-CoV-2 protects against lethal challenge and viral transmission
doi: 10.1101/2022.03.13.484172
Figure Lengend Snippet: (A) Schematic representation for the experimental timeline used to test the prevention of transmission by double ORF-deficient rSARS-CoV-2 in hamsters. (B) Sera collected at 18 days post-vaccination were evaluated for the neutralizing capacity against SARS-CoV-2 WA1/2020, Alpha (α), Beta (β), Delta (δ), and Omicron (o) VoC by PRMNT assay. (C) Summary of NT 50 values of sera against the different SARS-CoV-2 VoC. (D) In vivo imaging of the rSARS-CoV-2 mCherryNluc replication in hamsters at 2 and 4 dpi. (E) Quantitative analysis of Nluc expression in hamsters from panel D at 2 (left) and 4 (right) dpi.
Article Snippet:
Techniques: Transmission Assay, In Vivo Imaging, Expressing